Guide to all Numerical Text Analysis posts
Word histogram and Zipf plot of corpus for identifying stop words
After
- lowercasing,
- depunctuating,
- removing single atom words,
- removing single occurrence tokens,
- stemming and removing a few stop words (whether the 125 I have chosen or the ~ 450 in standard lists,
we are left with about 14000 tokens
from a bit less than 100 documents.
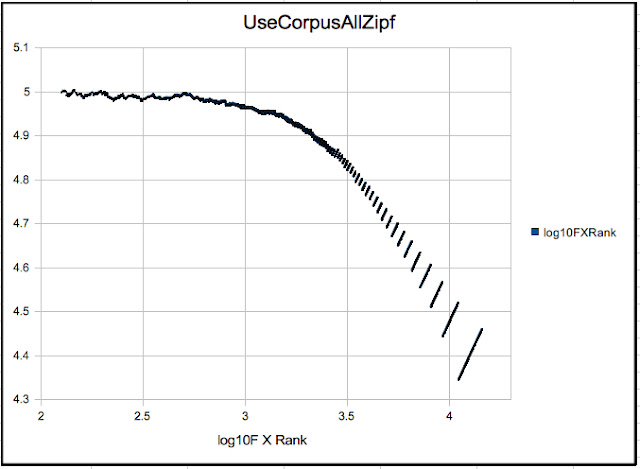
Here is the Zipf plot:
Before going on to the Cosine
Similarity business, let's think about Word-vector space. Each token
represents a dimension, the frequency of occurrence is the
coordinate. Each document represents a point in this space. So what
we have is a 14,000 dimensional space for a 100 points. That's
ridiculous! But let's consider we have a million documents, that is
still only 70 points per dimension!
Now of course this is going to vary
from case to case, e.g. the categorization problem I worked on had
25,000 points in 50,000 dimensions. Hardly a situation where standard
clustering algorithms – most of which are designed for denser
graphs (at least dimensionally speaking) can be expected to apply. My
solution to this is on SlideShare, and I'll blob on it at length
later.
My point, as was my point for selecting
stop words, is that some [statistical or numerical] and purpose-based
criteria have to be used to decide which set of tokens to use. If you
look at the Zipf plot above, in my view there are clearly three
families of tokens:
- the high ranking ones that approximate a Zipf line with a coefficient marginally less than 1
- the mid ranking tokens at the knee of the plot which fall off the Zipf line
- the low ranking tokens whose power law deviates very strongly from 1
My choices for the cutoffs are somewhat
arbitrary, but unimportant for now. Summarizing,
What do these mean? Consider the
extremely rare ones that occur only once in the corpus, and hence in
only one document. So they are extremely powerful for distinguishing
one document from another and a reasonably small set of these plus a
few that occur a few times (There may be a few documents which
contain no singly occurring tokens.) will be sufficient to label
every document uniquely. However, precisely because of their rarity,
we can't use them for finding any similarities between texts. So
these low ranking tokens lead to a very fine-graining of the set of
documents. Rejecting these will have the advantage of reducing the
dimensionality of word space by an order of magnitude.
What about the high-ranking ones? They
suffer from the converse problem, they occur so often in so many
texts that they are likely to not be able to distinguish well between
texts at all, which is sort of the motivation for throwing out the
stop words in the first place. (Though my suspicion is that stop
words are, or should be, chosen based on the smallness of the
standard deviation of their relative frequencies.) So short of
calculating these frequency standard deviations for the tokens, which
I hope to get to soon, we should reject these stochastic tokens,
the ones that closely follow Zipf's law (or Mandelbrot's
modification). Rejecting these will not
reduce the dimensionality of word-vector space by much, but it will
reduce the radial distance of the document-points from the origin,
the de facto
center for the Cosine Similarity.
So
we can use only 1500 mid-ranking tokens (that is “only” 15
dimensions per point, which is better than 144 dimensions per point)
for the next steps.
Last
point: before calculating Cosine Similarities, a standard step is to
scale all the token - frequencies by the log of the document
frequency for the token. This is a flat metric on wordspace. This
will have the effect of bringing down the weight at the high-ranking
end, and since log(f) increases slower than f, not scaling down as
much the low ranking end. So the overall weights of the tokens may
show precisely the bump in the mid-range that we want. So another
point for comparison.
So many choices, so little time.


No comments:
Post a Comment